
Libbey Inc. today reported results for the third quarter-ended September 30, 2014.
Third Quarter Financial Highlights
- Sales for the third quarter were $216.0 million, compared to $204.4 million for the third quarter of 2013, an increase of 5.7 percent (5.8 percent excluding currency fluctuation).
- Net income for the third quarter was $13.8 million, compared to $4.7 million in the prior-year third quarter. Adjusted net income for the third quarter of $13.8 million was nearly double the $7.4 million adjusted net income recorded in the third quarter of 2013.
- Income from operations for the third quarter was $20.7 million, compared to $14.0 million for the third quarter of 2013. Adjusted income from operations for the third quarter of $20.7 million was an improvement of 18.0 percent, compared to $17.6 million in the third quarter of 2013.
- Adjusted earnings before interest, taxes, depreciation and amortization (Adjusted EBITDA) for the quarter was $31.7 million, compared to $28.7 million in the prior-year quarter.
- Interest expense of $4.8 million was $2.9 million lower, compared to $7.7 million in the prior-year quarter.
“Sales growth was strong throughout the Company, as revenue increased in every segment and every channel of distribution. Revenues continued to be strong in the Americas where we achieved 5.6 percent revenue growth. For the second consecutive quarter, we were able to defend and grow our market share in an extremely competitive market,” said Stephanie A. Streeter, chief executive officer of Libbey Inc. 
- Sales in the Americas segment were $149.4 million, compared to $141.4 million in the third quarter of 2013, an increase of 5.6 percent (5.9 percent excluding currency impact). This was comprised of 7.3 percent higher sales in our foodservice channel, an increase of 4.5 percent in retail and a 5.7 percent increase in the business-to-business channel.
- Sales in the EMEA segment increased 6.2 percent (6.0 percent excluding currency impact) to $37.7 million, compared to $35.5 million in the third quarter of 2013.
- Sales in U.S. Sourcing were $20.6 million in the third quarter of 2014, compared to $19.9 million in the prior-year quarter, as sales of World Tableware and Syracuse China flatware and dinnerware increased 3.6 percent.
- Sales in Other were $8.3 million, compared to $7.6 million in the prior-year quarter, resulting from a 9.1 percent increase in sales (also 9.1 percent excluding currency impact) in the Asia Pacific region.
- Adjusted EBITDA of $31.7 million was $3.0 million higher than the $28.7 million reported in the prior-year quarter. The primary factors contributing to the improvement in adjusted EBITDA from the prior-year quarter include higher sales and the realization of savings of approximately $4.6 million from the recently completed North American capacity realignment, partially offset by the nearly $3.0 million impact of lower production activity related to an earlier-than-planned furnace repair, higher input costs for natural gas, packaging and electricity of$1.2 million, nearly $2.0 million in increased freight costs, as well as increased selling and marketing expenses.
- Interest expense was $4.8 million, a decrease of $2.9 million, compared to $7.7 million in the year-ago period, primarily driven by lower interest rates, as a result of the refinancing completed during the second quarter of 2014.
- Our effective tax rate was 20.4 percent for the quarter-ended September 30, 2014, compared to 15.0 percent for the quarter-ended September 30, 2013. The effective rate in both years was generally influenced by foreign earnings with differing statutory rates, foreign withholding tax, accruals related to uncertain tax positions, intra-period tax allocation and other activity in jurisdictions with recorded valuation allowances.
Nine-Month Financial Highlights
- Sales for the first nine months of 2014 were $621.1 million, compared to $597.8 million for the first nine months of 2013, an increase of 3.9 percent (or 3.8 percent excluding currency fluctuation).
- Income from operations for the first nine months of 2014 was $53.7 million, compared to $53.4 million during the first nine months of 2013.
- Adjusted EBITDA was $92.8 million for the first nine months of 2014, compared to $96.8 million for the first nine months of 2013.
To read the entire Libbey announcement, go here:
http://investorrelations.libbey.com/phoenix.zhtml?c=64169&p=irol-newsArticle&ID=1985308
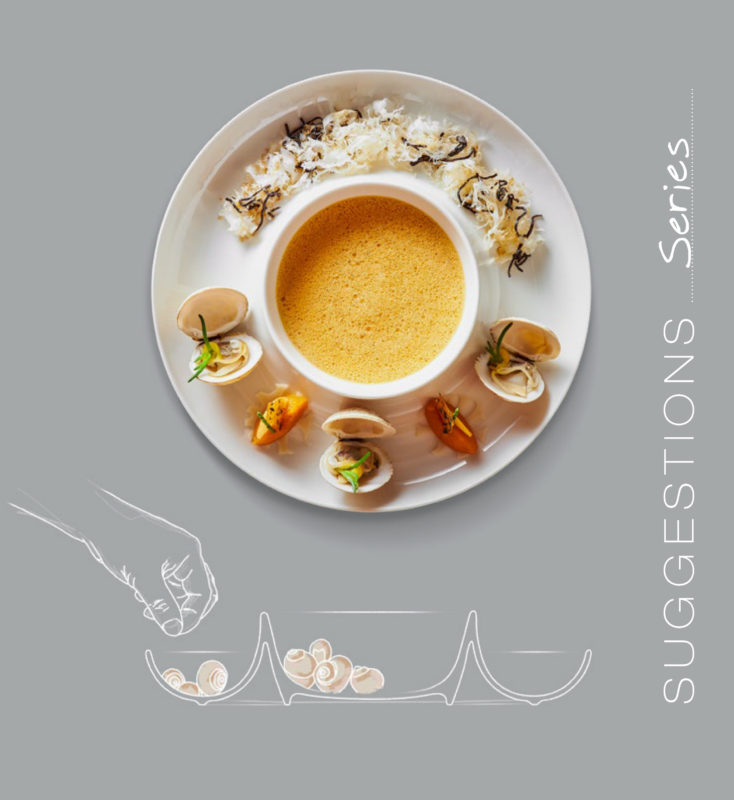
To learn more of Libbey’s wide range of hospitlaity tabletop products, go here:
https://foodservice.libbey.com/